Towards Unified Data Layers
Posted on Thu 27 October 2022 in General
 A Capriccio of Roman Ruins (1727-1729) by Marco Ricci
The opinions below, as always, are mine alone, and do not represent my employer’s, past or present.
Common Operating Datasets
The work done on Common Operating Datasets (CODs) has been one of the most important advances in information management in humanitarian response in the past 20 years.
Common Operating Datasets are typically country level administrative boundaries and population statistics. They are the basic building blocks of a response. In an emergency, with hundreds of organizations and government departments working together, they provide a common point of reference for geographical representation of areas and population within a country. In countries where there is a UNOCHA presence, they usually take the lead in the publishing of that country’s CODs, in coordination with the relevant government statistics office and relevant partners, revising and updating as needed. CODs are probably the most successful example of coordination of information management. [footnote link to Andrew Verity recent publication]
But… the purpose of this post is not just to praise the work on CODs, it’s to demonstrate emerging alternatives that overcome many of the issues we face with CODs.
So what’s wrong with the CODs?
The CODs are not always available at a level of granularity sufficient for detailed analysis. While admin 0 (national-level), admin 1 (typically provincial-level or similar), and admin 2 (typically district-level or similar) can be expected to present in any response with a UNOCHA presence, there can be less of an assumption of availability for the more granular levels of admin 3, 4 or lower. This presents a challenge as analysis may then be presenting analysis at a coarser level of aggregation that may not effectively capture or show differences in needs, gaps or response that a more granular administrative and population would support.
Admin boundaries are often disputed. While many national boundaries are disputed, to varying degrees [ footnote of how many, from Wikipedia] this generally isn’t a huge issue in most humanitarian responses. In comparison to, the challenge of different perspectives on sub-national boundaries within countries. This can lead to a situation where, depending on engagement at the national level, or with subnational authorities, different datasets may be needed, top reflect of the differing perspectives of what area or people that are being referred to. For compiling data, this means the added complexity of needing to know the context of the data received, to understand the perspectives of the data and the assumptions behind it.
High variation in the area and population that a COD unit is referring to. As mentioned above, the number of admin levels in a country can vary, what varies even greater, is the geographic area that COD units represent across countries. An analysis, that may be sufficiently granular in one country, may need to be at admin 3 or 4 in another to provide a similar analysis. While a typical analysis product may have a geographical area that may be optimal for the type of analysis, quite often this has to first match the closest available admin boundaries and population, assuming all required data is also available for this.
Within a single country, this variation in admin unit size can lead to misinterpretation of data when visualizing data. A common example of this is with the use of chloropleth maps. Considering two aspects of visual perception - colour and size, chloropleth’s often mislead, showing comparatively larger admin areas more prominently, even though their value (colour) may be the same or less. This misuse of choropleth graphics probably deserves an article by itself. [footnote showing the km2 area of the largest admin 3 and smallest admin2 from the CODs]
CODs are constantly changing, they are living datasets that periodically need updating to reflect administrative changes and population changes in a country. These administrative changes can mean that data from previous years may no longer be compatible with that which was gathered in different years [footnote Pakistan example of admin 1 changes] Currently the COD’s don’t have a process for version control, meaning that the changes of each iteration may not be known, meaning that datasets associated with previous COD versions may no longer be compatible, or may require significant data transformations or may contain a number of hidden assumptions.
Demographics and administrative boundaries are intertwined with politics. Administrative boundaries are, as the name suggests, reflect the administrative structure of a country. They are a cartographic manifestation of much of our countries historic dynamics, current political dynamics, especially in conflict situations, can themselves be drivers, or at least contentious within the context. The close link of the geographic and the political in-turn influences any analysis that uses them. Even in non, or low-conflict contexts, this can still mean challenges, such as delays in publishing or updating datasets due to bureaucracy or otherwise. [ footnote Idai example]
Introducing H3 and Bing quadkeys
One approach we can use that addresses or sidesteps the problems above to separate political & administrative with geographic concerns and base our geographic units of analysis on units that are consistent no matter what country, context or period the data is from.
There are many ways other than COD’s that can be used to separate and represent different geographic units, many reach back thousands of years [footnote mandala ] but in the past few years, with the growth in web-based mapping, large-scale analytics and the explosion of geo-associated data, some interesting approaches have emerged that are showing a lot of potential for humanitarian action.
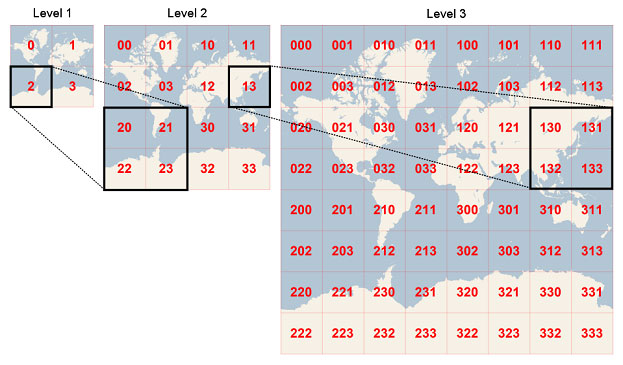
The first of these are Quadkeys an approach to geospatial indexing, developed by Microsoft, that divided the world into gridded squares [add footnote of Mercator projection limitation] with the size of each square corresponding to an index level. Each square can be subdivided further through subsequent lower levels, allowing one square to represent over 78,271 m2 at its highest level, or 0.0187 m2 at its lowest level.
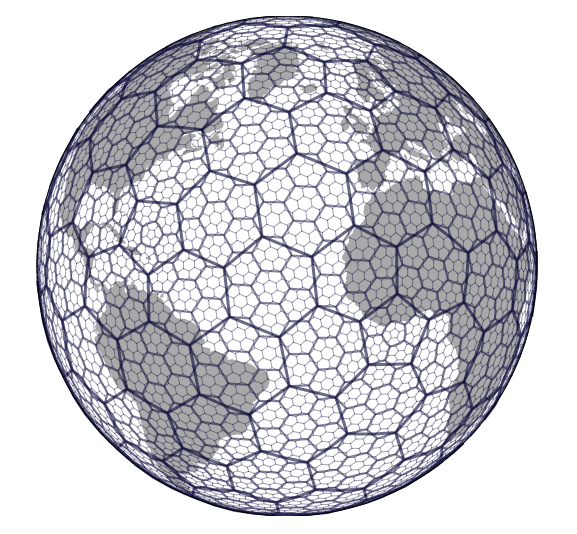
The second is H3, a similar concept, using hexagons. Developed by Uber, it provides a base for their vast geospatial analytic needs on car pickups, movements, routing etc.
Their advantages
These two approaches overcome many of the drawbacks of the CODs as:
-
the resolution/granularity is set to whatever unit that best suits the analysis, or which best matches the available data.
-
each quadkey/hex remains consistent and are inherently immune to disputes over their boundaries or names.
-
for any given quadkey/hex value, their areas remain consistent and comparable [add footnote explaining limitations/approximations due to CRS],
-
they don’t change; a quadkey of data from 100 years can be compared against a quadkey of data 100 years from now, regardless of any changes in administrative boundaries or naming conventions.
-
they offer a means to sidestep the issue of politics intertwined with geography.
-
they encourage privacy-preserving best practices for data analysis.
The possibilities
Imagine if, instead of struggling to reconcile development data that uses outdated admin boundaries into your humanitarian dataset, you can combine them seamlessly. Imagine, instead of using choropleths at wide admin-levels to show NGO partner presence, you present their presence as H3 cells at a resolution that better matches the catchment area of the services they are providing. Imagine being able to easily consolidate all your data, from demographics, displacement data, climate data, hazard risk data, household vulnerability data, to the same geographic unit of analysis to better inform prioritization and targeting of interventions.
If you are interested in finding out more about the unified data layer approach or would like to help me develop tools to accelerate its use, or if you have examples that you would like to share, please get in touch with me.
Note: The start of this post presents unified data layers as a replacement to COD’s. This is done more for shock value, to stimulate conversation, than in a belief that they could or should replace COD’s. Using admin-levels is preferable much of the time, as there is a clear need to understand and respond using geographic administrative structures that countries use to administer and govern.